The json array data output of the endpoint is as follows:
[
    {"month_year": "2023-04", "total": "24"},
    {"month_year": "2023-05", "total": "28"},
    {"month_year": "2023-06", "total": "23"},
    {"month_year": "2023-07", "total": "18"},
    {"month_year": "2023-08", "total": "33"},
    {"month_year": "2023-09", "total": "43"},
    {"month_year": "2023-10", "total": "36"},
    {"month_year": "2023-11", "total": "32"},
    {"month_year": "2023-12", "total": "25"},
    {"month_year": "2024-01", "total": "34"},
    {"month_year": "2024-02", "total": "41"}
]
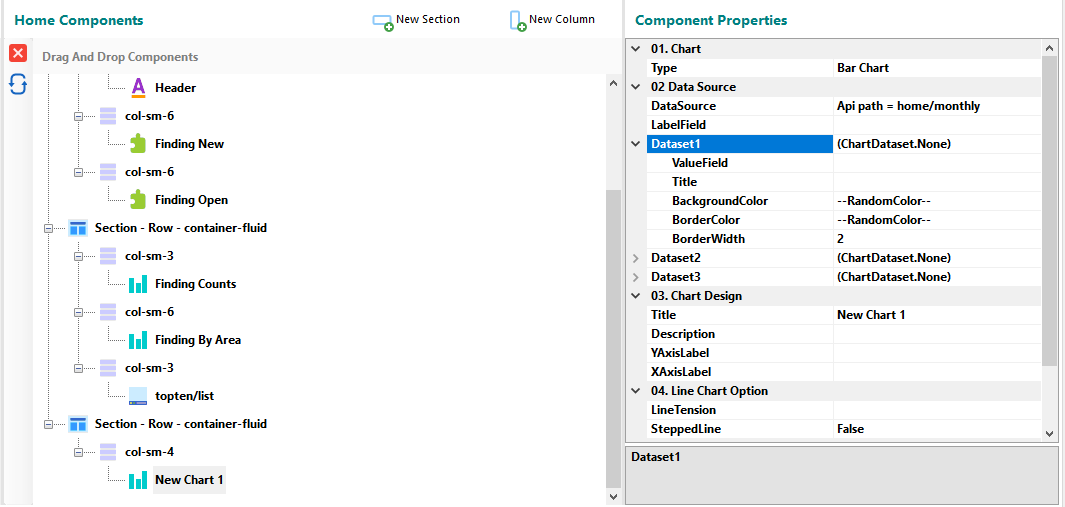
In the design of panel radsystems:
When published, I get an error like this:
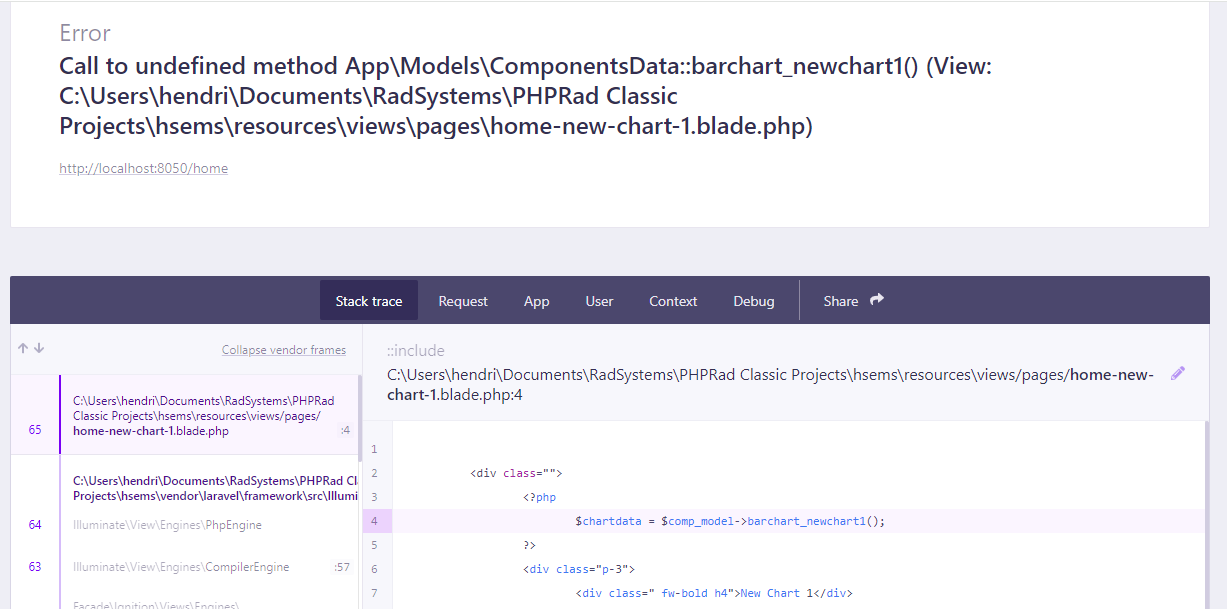
Is there a process I’m missing?
Please help